By Gerberal | July 8, 2026 | 12 min read
You've read the comparisons. You understand the structural differences between US and China ETFs, between REITs and developers, between broad market funds and thematic traps. Now comes the practical question: how do you actually put it all together?
Building a globally diversified ETF portfolio is harder than it looks. You need to decide on country weights. You need to choose specific ETFs for each sleeve. You need to think about currency exposure, tax treatment, and fee stacking. And if you're a cross-border investor — earning in one currency, spending in another, investing across multiple markets — the complexity compounds.
This guide walks through the process step by step, with real ETF tickers, real fee numbers, and three model portfolios for different investor profiles.
The Core Principle: Own the World, Tilt Toward What You Understand
The academic starting point for any equity portfolio is the global market-cap weight. As of mid-2026, that looks roughly like:
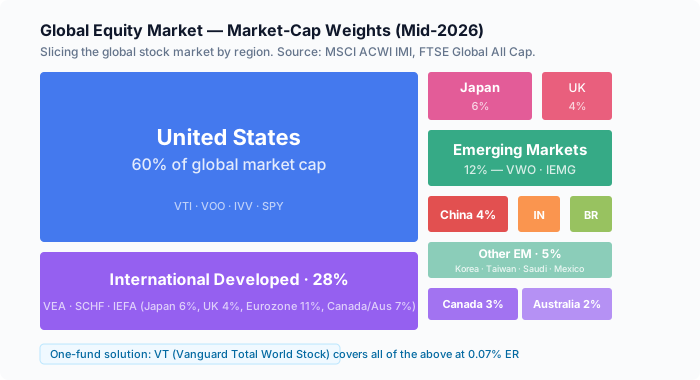
| Region | Market Cap Weight | Key ETFs |
|---|---|---|
| United States | ~60% | VTI (total), VOO (S&P 500) |
| International Developed | ~28% | VEA, SCHF, IEFA |
| Emerging Markets | ~12% | VWO, IEMG |
| Total | 100% | VT (single fund) |
The simplest global portfolio is one ETF: VT (Vanguard Total World Stock), which holds roughly 9,500 stocks across 50 countries at a 0.07% expense ratio. One fund. Global diversification. Zero rebalancing. Done. (For investors who prefer to build their own US sleeve, our S&P 500 ETF comparison covers VOO, IVV, and SPY in depth.)
But most investors — especially those reading a site called ETF Bridge — want more control. They want to tilt toward markets they understand (China, US), underweight regions they're skeptical about, or add factor tilts (value, size, quality). The cost of that control is complexity. The rest of this guide helps you manage it.
How I built my own portfolio — I hold a modified version of the global market-cap framework. My core is 40% VTI, 20% VEA, 10% VWO — the standard three-fund core. Then I overweight China to 15% (via 510300 accessed through Stock Connect) because that's the market I live in and understand best. The remaining 15% is split between sector satellites (semiconductors, infrastructure) and individual stock positions I've held for over a decade. This is not a recommendation — it's a disclosure. You should know where the person writing these words actually puts their money.
Step 1: Choose Your Core Building Blocks
The foundation of any global portfolio is three to five broad-market ETFs:
US Equity
| ETF | What It Covers | Expense Ratio | When to Use |
|---|---|---|---|
| VTI | Total US market (~3,600 stocks) | 0.03% | Default choice; maximum diversification |
| VOO | S&P 500 (~500 large caps) | 0.03% | If you want mega-cap tilt; nearly identical performance to VTI |
| SCHB | Broad US market (~2,500 stocks) | 0.03% | Schwab ecosystem alternative |
| ITOT | Total US market (~3,500 stocks) | 0.03% | iShares ecosystem alternative |
Recommendation: VTI. It captures the full US market — large, mid, and small caps — for 3 basis points. There is no practical reason to use anything more expensive for US core exposure.
International Developed
| ETF | What It Covers | Expense Ratio | When to Use |
|---|---|---|---|
| VEA | Developed ex-US (~4,000 stocks) | 0.05% | Default; Japan, UK, Germany, France, Canada, Australia, etc. |
| SCHF | Developed ex-US (~1,500 stocks) | 0.06% | Schwab alternative; fewer small caps |
| IEFA | Developed ex-US (~2,800 stocks) | 0.07% | iShares alternative; includes small caps |
Recommendation: VEA. At 5 basis points with 4,000+ holdings, it's the broadest and cheapest option.
Emerging Markets
| ETF | What It Covers | Expense Ratio | When to Use |
|---|---|---|---|
| VWO | EM all-cap (~5,100 stocks) | 0.08% | Default; includes China A-shares (partial) |
| IEMG | EM large + mid (~2,600 stocks) | 0.09% | iShares alternative; slightly less small-cap |
| EMXC | EM ex-China | 0.25% | If you hold separate China ETFs and want to avoid double-counting |
Recommendation: VWO for most. EMXC if you hold dedicated China positions.
One-Fund Alternatives
| ETF | Coverage | Expense Ratio |
|---|---|---|
| VT | Total world (~9,500 stocks, 50 countries) | 0.07% |
| ACWI | All-country world (~2,800 stocks) | 0.32% |
| SPGM | Total world; MSCI ACWI IMI index | 0.09% |
VT at 0.07% is cheaper than any combination of separate US + developed + EM ETFs, and it auto-rebalances. The case against VT is only that you cannot tilt — you accept market-cap weights as-is.
Step 2: Decide Your Regional Weights
The starting point is market-cap weight. From there, tilt based on your views and circumstances:
US-based investor (earns and spends in USD):
- US: 60-70% (market-cap weight + home bias; justified by lower costs and no currency risk on domestic consumption)
- International Developed: 20-25%
- Emerging Markets: 10-15%
China-based investor (earns and spends in RMB):
- China A-shares: 15-25% (home market; no currency risk on RMB consumption)
- Hong Kong / US-listed China: 5-10% (offshore China exposure)
- US: 35-45% (global growth engine; USD exposure)
- International Developed: 15-20%
- Emerging Markets ex-China: 5-10%
Global nomad (multi-currency, no fixed home market):
- US: 50-55% (largest, deepest market; holds value across currencies)
- International Developed: 25-30%
- Emerging Markets: 15-20% (higher growth, higher volatility)
Step 3: Add China Exposure (If Desired)
If you want China exposure beyond what VWO provides (~3% of a 60/30/10 portfolio), add dedicated China ETFs. The question is: onshore (A-shares), offshore (H-shares, ADRs), or both? For a detailed breakdown of the differences between ADRs, local stocks, and ETFs, see our ADR vs local stock vs ETF guide.
| China ETF | What It Covers | Expense Ratio | Role |
|---|---|---|---|
| ASHR | CSI 300 (A-shares, onshore) | 0.65% | Domestic China blue chips |
| FXI | FTSE China 50 (H-shares, HK-listed) | 0.74% | Large-cap offshore China |
| MCHI | MSCI China (broad, offshore) | 0.59% | Broader than FXI; includes tech |
| KWEB | China internet/tech | 0.69% | Concentrated China tech bet |
| 510300 (A-share) | CSI 300 ETF (onshore) | 0.20% | Cheapest China exposure; requires A-share account |
China allocation rules of thumb:
- If you already hold VWO, subtract ~3% (VWO's implied China weight in a 10% EM position) from your intended China weight
- A-shares (ASHR) and offshore China (FXI/MCHI) are imperfectly correlated (~0.7) — owning both adds diversification within China
- Total China exposure (all vehicles combined) above 20% of equity portfolio is concentrated; above 30% is a country bet, not a diversification
Step 4: Add Satellite Positions (Optional)
Satellites are 2-5% positions that express specific views. They are not necessary — a three-fund portfolio (VTI + VEA + VWO) is already globally diversified — but they can add targeted exposure:
| Satellite | ETF | Expense Ratio | Thesis |
|---|---|---|---|
| India growth | FLIN | 0.19% | Best EM demographics; structural reform story |
| Semiconductors | SMH | 0.35% | AI capex cycle; secular demand growth |
| China tech | KWEB | 0.69% | China internet recovery; valuation mean-reversion |
| Japan value | EWJ | 0.50% | Corporate governance reform; weak yen boost |
| Gold | GLD | 0.40% | Inflation hedge; portfolio insurance |
| REITs (income) | VNQ | 0.12% | Yield in a low-real-rate world |
| US small-cap value | AVUV | 0.25% | Factor premium; mean-reversion from large-cap dominance |
For a full discussion of how to construct a core-satellite portfolio with these kinds of positions, see our core-satellite portfolio guide. For investors interested in factor-based approaches, our factor investing and smart beta guide covers value, size, momentum, and quality tilts in detail.
Satellite sizing rule: Total satellites ≤ 20% of portfolio. Each individual satellite ≤ 5%. If you have more than five satellites, you're probably overcomplicating things.
Three Model Portfolios
Model 1: The Three-Fund Global Portfolio
For: Any investor who wants simplicity, low cost, and global diversification.
| ETF | Allocation | Expense Ratio | Annual Fee on $100K |
|---|---|---|---|
| VTI (US Total Market) | 60% | 0.03% | $18 |
| VEA (International Developed) | 25% | 0.05% | $12.50 |
| VWO (Emerging Markets) | 15% | 0.08% | $12 |
| Total | 100% | Blended 0.043% | $42.50 |
Three funds. $43/year on $100,000. 9,000+ stocks. 50+ countries. No rebalancing complexity.
Model 2: The China-Tilted Cross-Border Portfolio
For: China-based investors or anyone with a strong China conviction.
| ETF | Allocation | Role |
|---|---|---|
| VOO (S&P 500) | 35% | US large-cap core |
| VEA (International Developed) | 15% | Japan, Europe, Canada, Australia |
| VWO (Emerging Markets) | 8% | EM ex-China (at reduced weight) |
| ASHR (CSI 300) | 10% | China A-shares |
| FXI (FTSE China 50) | 7% | China offshore large-cap |
| 510300 (CSI 300 onshore) | 10% | Low-cost China via A-share account |
| FLIN (India) | 5% | India satellite |
| SMH (Semiconductors) | 5% | Tech sector satellite |
| Cash / Bonds | 5% | Dry powder / USD-CNH flexibility |
| Total | 100% | Blended fee ~0.18% |
Total China exposure: ~27% (ASHR 10% + FXI 7% + 510300 10% + VWO's China slice). Total EM exposure: ~35%. This is an aggressive cross-border portfolio — high growth, high volatility, high China concentration.
Model 3: The Global Nomad Portfolio
For: Multi-currency earners/spenders; no single home country.
| ETF | Allocation | Role |
|---|---|---|
| VT (Total World) | 50% | Core global equity; auto-rebalances |
| VOO (S&P 500) | 15% | US tilt (deepest, most liquid market) |
| VEA (International Developed) | 10% | Overweight developed stability |
| IEMG (Emerging Markets) | 10% | EM for growth |
| GLD (Gold) | 5% | Non-correlated insurance; currency-agnostic |
| VNQ (US REITs) | 5% | Hard asset income; inflation hedge |
| Cash (multi-currency) | 5% | Flexibility across currency blocks |
| Total | 100% | Blended fee ~0.10% |
This portfolio has no home-country bias, holds assets across all major currency blocks (USD, EUR, JPY, GBP, CNY via EM), and includes gold and REITs as non-correlated diversifiers.
Step 5: Implement, Rebalance, and Stay the Course
Implementation checklist:
- Choose a brokerage with access to all markets: Interactive Brokers is the default for cross-border investors. It supports trading on 150+ exchanges in 33 countries, holds multi-currency balances, and has competitive FX rates.
- Set up multi-currency funding: You shouldn't pay 2% FX spreads every time you convert. Fund accounts in your primary currency, then convert large batches at institutional rates.
- Use limit orders for everything except VTI/VOO: The three core ETFs (VTI, VEA, VWO) trade with penny-wide spreads. Satellites (ASHR, FLIN, EMXC) can have spreads of 0.05-0.15%. Use limit orders.
- Write down your rebalancing rules: e.g., "Rebalance annually in January. Rebalance any sleeve that deviates >20% from target (a 10% target drifting to <8% or >12%)."
- Don't look at it every day: The biggest risk to a well-constructed global portfolio is the investor who tinkers with it. Set it up. Rebalance once a year. Otherwise, leave it alone.
Cost checklist (annual drags on your portfolio):
| Cost | Typical Range | How to Minimize |
|---|---|---|
| ETF expense ratios | 0.03-0.70% | Use VTI/VEA/VWO for core; limit expensive satellites |
| FX conversion | 0.02-1.5% | IBKR institutional rates (~0.02%); avoid bank/brokerage retail FX |
| Dividend withholding tax | 0-30% | Understand treaty rates; hold foreign ETFs in taxable accounts carefully |
| Bid-ask spread (one-time) | 0.01-0.15% | Limit orders; trade during overlapping market hours |
| Rebalancing (capital gains) | Variable | Rebalance with new contributions; avoid selling to rebalance |
Common Mistakes to Avoid
1. Home-country bias in disguise: A US investor who holds 80% VTI, 10% VEA, 10% VWO is making a large US bet dressed up as a global portfolio. That's fine if it's intentional — but know that it's a bet.
2. Overlap without realizing it: Owning VOO (S&P 500), QQQ (Nasdaq-100), and VTI (total market) is redundant — VOO and QQQ are almost entirely contained within VTI. The overlap adds complexity without diversification. For a deeper dive into how these funds differ, see our Nasdaq-100 ETF comparison.
3. Currency mismatch: If you're a China-based investor who earns and spends in RMB, a 90% USD-denominated portfolio means your net worth swings with the USD/CNH exchange rate. Match your currency exposure to your future spending needs — not to where the best ETFs are listed. Our currency-hedged ETF guide explains when hedging makes sense and when it doesn't.
4. Thematic creep: It starts with one satellite (SMH, 5%). Then another (KWEB, 5%). Then a clean energy ETF. Then a robotics ETF. Before you know it, 40% of your portfolio is in thematic ETFs with 0.50-0.75% fees. Keep satellites small and few.
5. Over-rebalancing: Rebalancing more than once a year increases transaction costs, creates taxable events, and — counterintuitively — often reduces returns. Markets trend. Let winners run within reason.
The Bottom Line
A globally diversified ETF portfolio needs only three funds: VTI, VEA, VWO. Everything else — the China tilts, the India satellites, the sector bets, the REIT income sleeves — is optional. Useful if you have a well-reasoned view. Harmful if you're adding complexity for complexity's sake.
The hardest part of global ETF investing isn't picking the right funds. It's resisting the urge to trade them. Build your portfolio. Write down your rules. Rebalance once a year. Then go do something else with your time.
Continue reading: For a framework on structuring your core holdings versus tactical satellite positions, see our core-satellite ETF portfolio guide. If you're evaluating specific international exposures, our international developed ETFs comparison and emerging markets ETF guide provide deep dives into each sleeve.
Sources
- Vanguard — VTI, VEA, VWO, VT fund prospectuses and fact sheets, 2026
- MSCI — Global market-cap weight data and Emerging Markets Index methodology
- FTSE Russell — FTSE Global All Cap Index and country classification framework
- Morningstar — Portfolio construction research and ETF fee analysis
- Interactive Brokers — Cross-border brokerage capabilities and multi-currency account documentation
- PWC / Deloitte — Cross-border tax withholding rates by treaty country
- Fama, E.F. & French, K.R. (1992) — "The Cross-Section of Expected Stock Returns," Journal of Finance
- S&P Dow Jones Indices — SPIVA persistence scorecard (active vs. passive long-term performance)
Disclaimer: ETF Bridge is an educational resource. This article does not constitute investment advice. The model portfolios presented are illustrative examples, not personalized recommendations. Asset allocation should reflect your individual financial situation, risk tolerance, investment goals, and tax circumstances. Past performance does not guarantee future results. Currency fluctuations can significantly impact returns for cross-border investors. Always consult a qualified financial advisor before making investment decisions.