By Gerberal | June 30, 2026 | 10 min read
When you buy VOO, you're making a bet — whether you realize it or not. Because VOO weights stocks by market capitalization, every dollar you invest puts roughly 8 cents into Nvidia and less than a penny into 400 of the S&P 500's smaller names. That has been a fantastic bet for the last decade. It may not be for the next one.
There is an alternative: equal-weight ETFs, which give every S&P 500 stock the same 0.2% slice. The leading fund — Invesco's RSP — charges 0.20% for this service, versus VOO's 0.03%. And in 2026, for the first time in years, the more expensive equal-weight strategy is winning.
This article explains how these two weighting schemes work, why they produce dramatically different portfolios from the same 503 stocks, and which one belongs in your account right now.
Two Ways to Slice the Same Pie
| Cap-Weight (VOO) | Equal-Weight (RSP) | |
|---|---|---|
| Rule | Bigger company = bigger weight | Every company = same weight |
| Rebalance | Automatic (price moves update weights) | Quarterly (reset to equal) |
| Top holding | Nvidia ~7.9% | Each ~0.2% |
| Top 10 concentration | ~37% | ~2% |
| Tech sector weight | ~39% | ~15% |
| Financials weight | ~11% | ~15% |
| Expense ratio | 0.03% | 0.20% |
| AUM | $1.7 trillion | $85 billion |
Same 503 stocks. Radically different exposures. The difference is entirely in the weighting math.
How Cap-Weight Works
Most indices — including the S&P 500 — are float-adjusted market-cap weighted. Apple is worth ~$3.5 trillion, while Ralph Lauren is worth ~$12 billion. Apple is roughly 290× larger, so it gets roughly 290× more weight in VOO. This means cap-weight funds are:
- Auto-pilot: Prices change → weights change automatically. No rebalancing needed.
- Momentum-following: Stocks that go up get bigger weights. Winners compound.
- Concentrated: The largest stocks dominate returns — for better or worse.
How Equal-Weight Works
RSP starts each quarter by giving every S&P 500 stock exactly 1/503 ≈ 0.2% of the portfolio. Over the quarter, prices drift. At the end of the quarter, RSP rebalances — selling the winners back down to 0.2% and buying the losers back up. This means equal-weight funds are:
- Anti-momentum: Systematically sells winners, buys laggards.
- Diversified by construction: No single stock can dominate.
- Smaller-cap tilted: Mid-cap and smaller large-cap names get far more weight than in VOO.
The philosophical question: Do you believe the market is mostly right about which companies deserve more capital (cap-weight), or do you believe reversion to the mean will punish today's winners (equal-weight)?
The Performance History: A Tale of Two Decades
| Period | VOO (Cap-Weight) | RSP (Equal-Weight) | Winner |
|---|---|---|---|
| 2026 YTD (to late June) | ~+2% | ~+7% | RSP (+5pp) |
| 2025 Full Year | +17.8% | +11.2% | VOO (+6.6pp) |
| 2023 Full Year | +24.3% | +13.7% | VOO (+10.6pp) |
| 2022 Bear Market | -20% | -13% | RSP (+7pp less pain) |
| 5-Year Total (ann.) | +13.5% | +10.3% | VOO |
| 10-Year Total | +335% | +243% | VOO (+92pp) |
Sources: Nasdaq, ETF.com, Yahoo Finance, Barchart. Data approximate as of late June 2026.
The pattern is clear — and cyclical:
-
When mega-cap tech dominates (2017, 2019–2020, 2023–2024, 2025): VOO crushes RSP. The Magnificent Seven's earnings growth justifies their valuations, and cap-weighting rides the winners.
-
When leadership broadens (2022, 2026): RSP outperforms. Mega-caps stall, financials and industrials carry the market, and equal-weight's anti-momentum rebalancing pays off.
-
Over the very long term (decades): VOO wins — but the gap is largely explained by a handful of extraordinary tech companies compounding at rates that cap-weight captured more fully.
Why 2026 Has Been the Year of Equal-Weight
Three forces have converged to flip the script in 2026:
1. AI capex fatigue. Nvidia, Microsoft, Meta, and Alphabet have collectively committed over $300 billion to AI infrastructure buildout. The spending is enormous, the near-term returns are uncertain, and shareholders are getting impatient. Nvidia's stock — the single largest driver of VOO's outperformance for three years — has stalled. When the top name stalls, cap-weight feels it acutely.
2. Financials and industrials are thriving. Higher-for-longer interest rates benefit banks (JPMorgan, Goldman Sachs), and a manufacturing resurgence benefits industrials (GE Aerospace, Caterpillar). These sectors are 11% and 8% of VOO, respectively — but 15% and 14% of RSP. Equal-weight captures more of this strength.
3. The concentration discount. At 39% tech and a 28.6x P/E, VOO is priced for continued tech dominance. RSP, with its balanced sector mix, trades at a materially lower multiple. When investors rotate away from growth and toward value, equal-weight's cheaper sectors benefit.
Sector Exposure: The Same Stocks, Different Portfolios
| Sector | VOO Weight | RSP Weight | Difference |
|---|---|---|---|
| Technology | 39% | 15% | VOO: +24 pp |
| Financials | 11% | 15% | RSP: +4 pp |
| Industrials | 8% | 14% | RSP: +6 pp |
| Communication | 11% | 5% | VOO: +6 pp |
| Consumer Cyclical | 10% | 10% | Equal |
| Healthcare | 8% | 10% | RSP: +2 pp |
| Consumer Defensive | 5% | 8% | RSP: +3 pp |
| Energy | 3% | 8% | RSP: +5 pp |
| Utilities | 2% | 8% | RSP: +6 pp |
| Real Estate | 2% | 5% | RSP: +3 pp |
| Materials | 2% | 5% | RSP: +3 pp |
VOO is a concentrated bet on American technology dominance. RSP is a broad bet on the American economy. Both are valid — but they are not the same investment.
Has the Concentration Become Too Extreme?
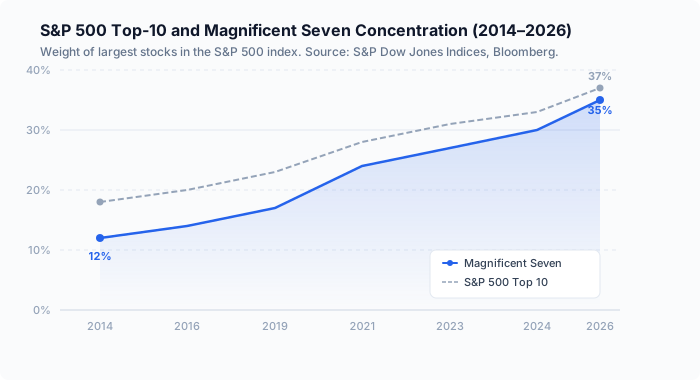
The top 10 stocks in the S&P 500 now account for roughly 37% of the index — the highest in modern history, surpassing even the dot-com peak:
| Year | Top 10 Weight | Dominant Names |
|---|---|---|
| 1980 | ~20% | IBM, AT&T, Exxon, General Electric |
| 1999 (dot-com peak) | ~27% | Microsoft, Cisco, GE, Intel, Walmart |
| 2010 | ~20% | Exxon, Apple, Microsoft, GE, J&J |
| 2020 | ~27% | Apple, Microsoft, Amazon, Alphabet, Facebook |
| 2026 | ~37% | Nvidia, Apple, Microsoft, Amazon, Alphabet |
Source: S&P Dow Jones Indices, Barchart.
Concentration alone doesn't mean a crash is coming. The dot-com top 10 earned their weight through earnings, not just narrative — and today's top 10 are far more profitable than 1999's. But concentration amplifies downside risk. If AI spending disappoints, VOO's top-heavy structure turns a sector correction into an index-level event.
The Fee-Gap Argument
RSP charges 0.20% vs. VOO's 0.03% — a gap of 17 basis points per year. Over 30 years, that gap compounds to a meaningful difference:
| Scenario | VOO (0.03%) | RSP (0.20%) | Fee Drag |
|---|---|---|---|
| $100K, 30 yr, 7% return | ~$748,700 | ~$733,300 | $15,400 |
But fees are only one variable. Performance differences between the two strategies have been measured in percentage points per year — not basis points. The weighting methodology matters far more than the fee.
Bottom line: If you believe the next decade will look like the last (tech dominance, concentrated returns), VOO's 0.03% fee is a bargain. If you believe leadership will broaden and rotate, RSP's 0.20% fee may be worth paying.
Who Should Choose Which?
| Your View / Situation | Best Choice |
|---|---|
| Believe AI and mega-cap tech will continue dominating | VOO (0.03%) — cap-weight rides the winners |
| Concerned about concentration risk | RSP (0.20%) — no single stock >0.2% |
| Think 2026's rotation has further to run | RSP — equal-weight historically outperforms for 3–5 years after regime shifts |
| Want the lowest possible cost | VOO — the cheapest S&P 500 fund at 0.03% |
| Want more dividend income | RSP (~1.6% yield vs. VOO's ~1.0%) |
| Want a middle ground | Split 50/50 — half VOO, half RSP. Capture some of both |
| Active trader / options user | RSP has decent options liquidity; VOO's is thinner (use SPY for options) |
The 50/50 Compromise
One of the most practical strategies doesn't require choosing sides. A portfolio split between VOO (or SPY) and RSP gives you:
- 50% cap-weight exposure (rides the winners)
- 50% equal-weight exposure (reduces concentration risk)
- Blended expense ratio of ~0.12% (still very cheap)
- Sector allocation closer to historical norms
- Automatic rebalancing if you reinvest dividends proportionally
You don't need to predict whether mega-cap tech will continue to dominate. You own both paths and let the market decide.
Key Takeaways
-
Same 503 stocks, different bets. VOO is a bet on American tech dominance continuing. RSP is a bet on the broader American economy.
-
Ten-year history favors VOO (335% vs. 243%) — but the outperformance is almost entirely explained by a handful of extraordinary tech stocks.
-
2026 has favored RSP — the rotation from mega-cap growth into value and cyclicals has given equal-weight its best relative year since 2022.
-
Concentration is at historic highs — the top 10 at 37% of the S&P 500 surpasses the dot-com peak. This doesn't predict a crash, but it increases vulnerability to sector-specific shocks.
-
The 50/50 split solves the dilemma — you don't have to choose. Own both and let the market sort it out.
Continue reading: Now that you understand weighting, learn how to read an ETF fact sheet to verify a fund's concentration for yourself — or explore what tracking error really means and why it matters more than fees.
Sources
- Nasdaq — "VOO vs RSP: Which S&P 500 ETF Is Better?" and "S&P 500 Comparison: RSP vs VOO" (2026)
- ETF.com — "As Mega Caps Stall, Equal Weight Makes a Comeback" (2026)
- NAI500 — "VOO vs RSP: The Hidden Risk in Buffett's Go-To S&P 500 ETF" (June 2026)
- Barchart — "2025 ETF Wrap-Up & What to Expect in 2026" and "How Long Can Equal-Weighted ETFs Keep Outperforming?" (2026)
- Wedbush — "The Great Rotation of 2026: Equal-Weight ETFs Surge" (March 2026)
- S&P Dow Jones Indices — historical top-10 concentration data
- Invesco — RSP fact sheet (June 2026)
- Vanguard — VOO fact sheet (June 2026)
Disclaimer: ETF Bridge is an educational resource. This article does not constitute investment advice. Past performance does not guarantee future results. Performance comparisons between VOO and RSP reflect data as of late June 2026 and may change. Weighting methodology preferences depend on individual investment objectives, time horizon, and risk tolerance. Always consult a qualified financial advisor before making investment decisions. Investing involves risk, including the potential loss of principal.