By Gerberal | July 17, 2026 | 10 min read
Table of Contents
- What Is a Covered Call ETF? The Simple Mechanics
- The Major Players: JEPI, JEPQ, XYLD, QYLD, DIVO
- The Yield: How 8-12% Is Actually Generated
- The Hidden Costs: Capped Upside, Full Downside
- Tax Treatment: Why Covered Call ETF Distributions Are Tax-Inefficient
- Total Return vs Yield: What the Backtest Shows
- When Covered Call ETFs Make Sense — And When They Don't
1. What Is a Covered Call ETF? The Simple Mechanics
A covered call strategy is the simplest options strategy in finance: you own a stock (or basket of stocks), and you sell a call option against it. The buyer of the call option pays you a premium — cash in your pocket today. In exchange, you give up any upside above the option's strike price.
Example: You own 100 shares of Apple at $200. You sell a call option with a $220 strike price, collecting a $5 premium (2.5% of the stock value). Two possible outcomes:
- Apple closes below $220 at expiration: You keep the $5 premium and your shares. Repeat next month. You just earned 2.5% in a flat market.
- Apple closes at $250 at expiration: You must sell at $220. You keep the $5 premium, the $20 gain from $200 to $220 — but you miss the additional $30 gain from $220 to $250. Your upside was capped.
A covered call ETF automates this process: it holds a portfolio of stocks (usually the S&P 500 or Nasdaq-100) and systematically sells call options against all or part of the portfolio. The premiums collected are distributed to shareholders as income.
The fundamental tradeoff: You are exchanging upside potential (above the strike price) for current income (the options premium). In flat or down markets, this trade is favorable — you earn income while the stock goes nowhere. In strong bull markets, this trade is unfavorable — your gains are capped while the market runs away from you.
2. The Major Players: JEPI, JEPQ, XYLD, QYLD, DIVO
The covered call ETF universe has exploded since 2020. Here are the five that matter most:
| ETF | Ticker | Expense Ratio | Distribution Yield | Underlying | Strategy |
|---|---|---|---|---|---|
| JPMorgan Equity Premium Income ETF | JEPI | 0.35% | ~7-9% | Actively managed US large-cap stocks (~130 holdings) | Sells out-of-the-money S&P 500 call options on ~20% of portfolio via ELNs |
| JPMorgan Nasdaq Equity Premium Income ETF | JEPQ | 0.35% | ~9-11% | Actively managed Nasdaq-100-oriented stocks | Same as JEPI but with Nasdaq-100 call options |
| Global X S&P 500 Covered Call ETF | XYLD | 0.60% | ~8-10% | S&P 500 (all 500 stocks) | Sells at-the-money calls on 100% of the portfolio monthly |
| Global X Nasdaq 100 Covered Call ETF | QYLD | 0.60% | ~10-12% | Nasdaq-100 (all 100 stocks) | Same as XYLD but on Nasdaq-100 |
| Amplify CWP Enhanced Dividend Income ETF | DIVO | 0.55% | ~4-5% | Actively managed ~25 large-cap dividend stocks | Sells covered calls selectively on individual stocks |
JEPI and JEPQ (0.35%) are the category leaders, with JEPI alone exceeding $30 billion in AUM. Their key differentiation from the Global X funds:
- Partial overwrite: JEPI/JEPQ only sell calls on ~20% of the portfolio, not 100%. This means ~80% of the portfolio participates fully in market upside.
- Active stock selection: Instead of passively holding the full S&P 500, JEPI's managers select roughly 130 lower-volatility, higher-quality stocks.
- Equity-Linked Notes (ELNs) : JEPI uses ELNs — structured notes issued by banks — to generate the options premium, rather than directly writing exchange-traded options. This adds a layer of counterparty risk that most investors don't think about.
- Monthly distributions: Like all covered call ETFs, distributions are monthly and variable — they depend on options premiums collected that month, which fluctuate with market volatility.
XYLD and QYLD (0.60%) are the old guard. They write at-the-money calls on the entire portfolio — meaning their upside cap is harsher, but their premium income is higher. At 60 basis points, their fees are significantly higher than JEPI/JEPQ.
DIVO (0.55%) takes a different approach: actively selected dividend stocks with selective covered call writing. The yield is lower (4-5%) but the total return profile is more balanced — DIVO has historically captured more upside than its peers because it overwrites less aggressively.
3. The Yield: How 8-12% Is Actually Generated
The headline distribution yields on these ETFs look almost too good to be true. In some ways, they are. Understanding the components:
Options premium: The core income source. When market volatility (VIX) is high, options premiums are rich — covered call ETFs generate more income. When the VIX is low (12-15 range), premiums shrink and distribution yields fall. The yield is not fixed — it's a function of market conditions that change monthly.
Dividends from underlying stocks: The stocks in the portfolio pay their regular dividends, which get passed through to ETF shareholders. This is roughly 1.3-1.5% for S&P 500-oriented funds and ~0.8% for Nasdaq-100 funds.
Return of capital (ROC) : This is the part most investors miss. Some covered call ETFs classify a portion of their distributions as return of capital — meaning they're giving you back your own money. ROC is not taxable in the year received (it reduces your cost basis), but it means the distribution is not entirely new income. If an ETF has a 10% distribution yield but 3% is ROC, the "real" yield is closer to 7%.
The VIX yield relationship: In March 2020, when the VIX spiked to 82, covered call ETFs were generating enormous premiums — but their underlying stock portfolios were crashing. In the low-VIX environment of 2017 (VIX ~11), distribution yields were roughly half of what they were in 2022 (VIX ~25). When you buy a covered call ETF, you're implicitly betting on sustained or elevated volatility. In calm markets, the yield math deteriorates.
4. The Hidden Costs: Capped Upside, Full Downside
This is the part that covered call ETF marketing materials downplay:
Upside cap: XYLD and QYLD write calls on 100% of the portfolio at-the-money. This means in any month where the market rises, your gain is limited to roughly the call premium (~1-2% per month) plus dividends. If the S&P 500 rallies 8% in a month (as it did in November 2020 and several times since), an XYLD holder captures perhaps 2% and misses the other 6%. Over time, these missed rallies compound into significant underperformance.
Full downside participation: This is the brutal part. The covered call strategy collects a premium — typically 1-2% per month — which provides a small cushion against losses. But beyond that cushion, you participate fully in market declines. If the S&P 500 drops 20% in a quarter, XYLD might drop 17-18%. The premium softens the blow slightly, but it does not protect against a bear market the way bonds or low-volatility strategies do.
The asymmetry in one sentence: You participate in 100% of the downside (minus a ~1% monthly cushion) but only ~20-30% of the upside in strong rallies. Over full market cycles, this asymmetry means covered call ETFs tend to underperform their underlying indexes in total return — often by a significant margin.
| Market Scenario | S&P 500 Return | JEPI Approximate Return | XYLD Approximate Return |
|---|---|---|---|
| Strong bull (+20% year) | +20% | +10-12% | +6-8% |
| Moderate bull (+10% year) | +10% | +8-10% | +7-9% |
| Flat (0% year) | 0% | +7-9% | +8-10% |
| Moderate bear (-10% year) | -10% | -4% to -2% | -2% to 0% |
| Severe bear (-20% year) | -20% | -14% to -12% | -16% to -14% |
The pattern is clear: covered call ETFs outperform in flat and mildly down markets — and underperform everywhere else. The question isn't whether they work (they do, in the right conditions), but whether those conditions persist long enough to justify the strategy.
5. Tax Treatment: Why Covered Call ETF Distributions Are Tax-Inefficient
If you hold covered call ETFs in a taxable account, the tax treatment is significantly worse than qualified dividends from VOO or SCHD:
- Most distributions are taxed as ordinary income, not qualified dividends. At the top marginal rate (37% federal + 3.8% NIIT), you're losing roughly 40% of the distribution to taxes.
- In comparison: VOO's ~1.3% dividend is 100% qualified — taxed at 20% max (plus NIIT for high earners, total ~23.8%). A 10% covered call distribution taxed at 40% yields 6% after-tax. A 1.3% qualified dividend taxed at 23.8% yields ~1.0% after-tax. The covered call ETF still provides more after-tax income, but the tax drag narrows the gap substantially.
- Return of capital distributions reduce your cost basis. If you hold long enough and your basis goes to zero, all subsequent ROC distributions become taxable as capital gains. This is a deferred tax liability, not forgiveness.
The right place for covered call ETFs: A tax-deferred account (IRA, 401(k)) where distributions are not taxed annually. In a taxable account, the tax drag is severe enough to reconsider whether the strategy is worth it.
For a deeper discussion of cross-border investing mechanics, see our ADR vs Local Stock vs ETF guide.
6. Total Return vs Yield: What the Backtest Shows
Investors often fixate on distribution yield while ignoring total return. A 10% yield with -3% price decline is a 7% total return. A 1.3% yield with 15% price appreciation is a 16.3% total return. Over the long run, total return is what builds wealth — not yield.
Since JEPI's inception (May 2020) through mid-2026:
| Fund | Annualized Total Return | Annualized Distribution Yield |
|---|---|---|
| VOO (S&P 500, no options) | ~14.5% | ~1.4% |
| JEPI | ~11.0% | ~8.0% |
| XYLD | ~8.5% | ~9.5% |
| QYLD | ~10.0% | ~11.0% |
JEPI has delivered respectable total returns — trailing VOO by about 3.5% annually, but with much higher current income. XYLD and QYLD have lagged more significantly because their 100% overwrite strategy caps upside more aggressively.
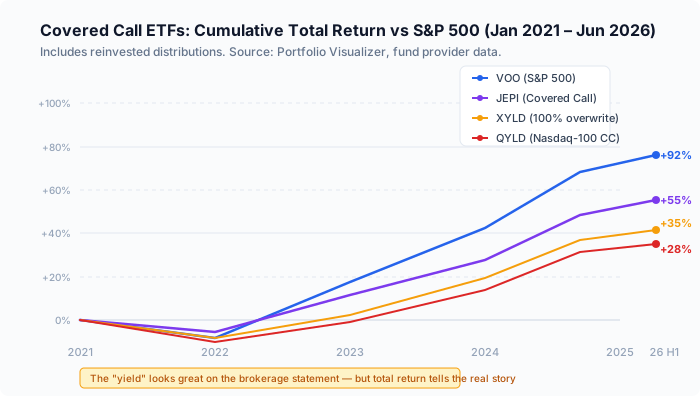
The pattern that repeats: Covered call ETFs underperform their underlying indexes in bull markets (2020, 2021, 2023, 2024) and outperform in flat or down markets (2022). Over full cycles, the net effect is total return somewhere between bonds and equities — with equity-like volatility and bond-like upside.
7. When Covered Call ETFs Make Sense — And When They Don't
Reasonable use cases:
-
Retirees prioritizing current income over total return. If you're withdrawing 4-5% annually from your portfolio anyway, replacing some equity exposure with JEPI (distributing 7-9%) means the fund generates the cash you need without selling shares. The capped upside is a cost you accept in exchange for not having to sell into down markets.
-
A bond alternative in a low-real-yield environment. If 10-year Treasuries are yielding 4.2% with no upside participation, and JEPI is yielding 8% with some equity upside and similar volatility — the income investor may prefer the covered call fund. But the risk profiles are different, and this is not a like-for-like substitution.
-
Tactical allocation in sideways markets. If you believe the market will trade in a range for an extended period, covered call strategies maximize returns in that environment. The challenge, as always, is knowing when the sideways market will end.
When they don't make sense:
- Young investors in the accumulation phase. You want total return, not current income. VOO has outperformed all covered call ETFs by a wide margin over the long term.
- Taxable accounts (unless you're in a very low tax bracket).
- As a replacement for your core equity allocation. If you sell VOO to buy JEPI, you're trading total return for income. Make that trade consciously, not because the 8% yield looks attractive in isolation.
- When you don't understand what you're buying. The ELN structure in JEPI/JEPQ, the 100% overwrite in XYLD/QYLD, the ROC component of distributions — if these concepts are unfamiliar, do your homework before allocating.
The bottom line: Covered call ETFs are tools, not free lunches. The 8-12% yield is real income, but it comes from selling something valuable — the right to participate in market rallies.
Personal experience: I held JEPI for two years (2022-2023) in my IRA — roughly 8% of that account. The monthly distributions were psychologically satisfying (getting "paid" every month while the market struggled), but I sold it in early 2024 when it became clear that we were entering a bull market where capped upside mattered. The total return I earned was about 9% annualized vs 18% for VOO over the same period. JEPI did exactly what it was designed to do — produce income in a flat/down market. It was not designed to capture a bull market, and when the bull arrived, I switched back to the S&P 500. Covered call ETFs are a weather-dependent tool. Know the forecast before you deploy them.
As long as you understand that tradeoff and size the allocation appropriately (5-15% of a portfolio for most investors who choose to use them), they serve a legitimate purpose. As a 100% strategy, they're almost certainly a mistake.
Sources
- JPMorgan Asset Management — JEPI (JPMorgan Equity Premium Income ETF) fund page and fact sheet
- JPMorgan Asset Management — JEPQ (JPMorgan Nasdaq Equity Premium Income ETF) fund page
- Global X ETFs — XYLD/QYLD (S&P 500 / Nasdaq-100 Covered Call ETFs) fund pages and distribution data
- CBOE (Chicago Board Options Exchange) — CBOE S&P 500 BuyWrite Index (BXM) methodology and historical data
- Morningstar — covered call ETF category analysis and risk/return comparison
- ETF.com — covered call ETF screener and side-by-side performance comparison
- Amplify ETFs — DIVO (Amplify CWP Enhanced Dividend Income ETF) fund page
- Fidelity Investments — options-based ETF educational resources and tax treatment guide
Disclaimer: This article is for informational purposes only and does not constitute investment advice. Covered call ETFs involve options-related risks, counterparty risk (for ELN-based strategies), and tax complexity beyond conventional equity ETFs. Distribution yields are variable and not guaranteed. Consult a tax professional and financial advisor before investing. Past performance does not guarantee future results.
More income and strategy articles: