By Gerberal | July 12, 2026 | 10 min read
For most of the last decade, dividend investing was unfashionable. With the 10-year Treasury yielding under 2% and growth stocks compounding at 20-30% annually, a 3% dividend yield with 5% annual dividend growth felt like a consolation prize. Why collect $3,000 a year in dividends from a stodgy consumer staples fund when Nvidia was doubling every 18 months? (For a comparison of growth versus value approaches, see our growth vs value ETF guide.)
2026 has a different feel. The Fed cutting cycle is underway, taking the 10-year Treasury from 5% in late 2023 to roughly 3.75% today. Growth stocks remain expensive. And after the July 2026 semiconductor correction — which erased an estimated $800 billion in market value in five trading days — the appeal of getting paid to wait has never been clearer.
This article compares the three major dividend ETF strategies: US dividend aristocrats (companies with 25+ years of consecutive dividend increases), US high-dividend value (SCHD), and international/China dividend ETFs — with real yields, real fees, and a framework for choosing between them.
The Three Dividend Strategies
| Strategy | Focus | Key Metric | Risk Level | Example ETFs |
|---|---|---|---|---|
| Dividend Aristocrats | Dividend growth consistency | Consecutive years of increases | Lowest | NOBL, REGL |
| High Dividend / Quality Value | Current yield + fundamentals | Yield + payout ratio + ROE | Low-Medium | SCHD, VYM, DGRO |
| International / Emerging High Yield | Highest current yield | Yield + currency stability | Medium-High | VYMI, SCHY, China SOE ETFs |
These are not interchangeable. A dividend aristocrats ETF (NOBL) yields roughly 2.0-2.2%. A high-dividend value ETF (SCHD) yields roughly 3.5%. A China state-owned enterprise dividend ETF yields 5-7%. The yield difference reflects genuine differences in underlying company quality, growth prospects, currency risk, and payout sustainability.
Strategy 1: US Dividend Aristocrats — Safety First
The S&P 500 Dividend Aristocrats Index tracks S&P 500 companies that have increased their dividend every year for at least 25 consecutive years. As of mid-2026, there are approximately 67 companies in the index.
Think about what 25 years of consecutive dividend increases means. A company in the index today had to raise its dividend through:
- The 2000 dot-com crash (one of the worst bear markets in history)
- The 2008-2009 Global Financial Crisis (when many banks cut or eliminated dividends)
- The 2015-2016 energy crash (when oil majors slashed payouts)
- The 2020 COVID pandemic (when dividends were frozen across entire sectors)
- The 2022 rate-hiking cycle (when recession fears were everywhere)
Twenty-five consecutive years of increases is not a financial metric. It's a cultural commitment — a signal that returning cash to shareholders is embedded in the company's DNA, not a discretionary decision that gets cut when times get tough.
Dividend Aristocrats ETFs
| ETF | Ticker | Expense Ratio | AUM | Holdings | Yield |
|---|---|---|---|---|---|
| ProShares S&P 500 Dividend Aristocrats | NOBL | 0.35% | ~$12B | ~67 stocks | ~2.1% |
| ProShares S&P MidCap 400 Dividend Aristocrats | REGL | 0.40% | ~$1.5B | ~45 stocks | ~2.5% |
NOBL is equal-weighted — each aristocrat gets roughly 1.5% of the portfolio. This avoids the trap of dividend ETFs that become accidental bets on a few mega-cap dividend payers.
NOBL top holdings (mid-2026):
| Company | Weight | Dividend Streak | Sector |
|---|---|---|---|
| Linde | ~1.5% | 30+ years | Materials/Industrial Gases |
| Aflac | ~1.5% | 40+ years | Insurance |
| Caterpillar | ~1.5% | 30+ years | Industrials |
| Exxon Mobil | ~1.5% | 40+ years | Energy |
| Johnson & Johnson | ~1.5% | 60+ years | Healthcare |
| Procter & Gamble | ~1.5% | 65+ years | Consumer Staples |
| Coca-Cola | ~1.5% | 60+ years | Consumer Staples |
| AbbVie | ~1.5% | 50+ years | Pharmaceuticals |
The sector mix is defensive by nature: consumer staples, industrials, healthcare, and utilities dominate. Technology is underweight because few tech companies have paid dividends for 25+ years (Apple only started paying in 2012; Microsoft in 2003 — both qualify now, but just barely).
NOBL Performance
| Period | NOBL | VOO (S&P 500) | Difference |
|---|---|---|---|
| YTD 2026 | +8% | +11% | −3% |
| 2025 | +10% | +25% | −15% |
| 2024 | +8% | +26% | −18% |
| 2022 (bear market) | −6% | −19% | +13% |
| 10-Year Ann. (2016–2025) | +11% | +14% | −3% |
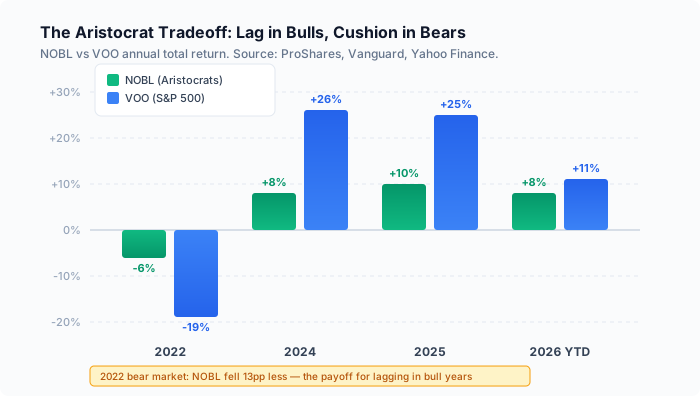
NOBL underperforms in bull markets — dramatically in 2024 and 2025, when growth stocks dominated. But in 2022, when the S&P 500 fell 19%, NOBL fell only 6%. That 13% outperformance is the dividend aristocrat premium: defense that doesn't cost you in the long run. Over 10 years, NOBL has compounded at 11% vs 14% for the S&P 500 — a lower return, but with significantly lower volatility and drawdowns.
Best for: Investors who prioritize capital preservation, inflation-adjusted income growth, and sleeping well during bear markets. Retirees. Anyone trying to build a portfolio they won't panic-sell when the next correction hits.
Strategy 2: High Dividend / Quality Value — The Sweet Spot
SCHD (Schwab US Dividend Equity ETF) is not a dividend aristocrats fund. It's a fundamentally-weighted high-dividend ETF that screens for:
- Yield: High relative to the market
- Payout ratio: Sustainable — not paying out more than they earn
- ROE: Profitable companies, not yield traps
The result is a portfolio of roughly 100 stocks with a 3.5% yield, 0.06% expense ratio, and a track record that has made SCHD one of the most popular dividend ETFs in the world ($60B+ AUM).
| ETF | Ticker | Expense Ratio | AUM | Holdings | Yield |
|---|---|---|---|---|---|
| Schwab US Dividend Equity | SCHD | 0.06% | ~$65B | ~100 stocks | ~3.5% |
| Vanguard High Dividend Yield | VYM | 0.06% | ~$70B | ~450 stocks | ~2.9% |
| iShares Core Dividend Growth | DGRO | 0.08% | ~$30B | ~400 stocks | ~2.3% |
SCHD vs NOBL: The Practical Choice
| Dimension | NOBL (Aristocrats) | SCHD (Quality Yield) |
|---|---|---|
| Yield | ~2.1% | ~3.5% |
| Expense Ratio | 0.35% | 0.06% |
| Dividend Growth Rate | ~8% annually | ~6% annually |
| Holdings | ~67 | ~100 |
| Weighting | Equal weight | Fundamental (yield + quality) |
| Sector Tilt | Defensive (staples, industrials, healthcare) | Financials, healthcare, consumer |
| 10-Year Return | +11% | +12% |
SCHD has outperformed NOBL over 10 years while charging one-sixth the fee. The 3.5% yield is roughly 70% higher than NOBL's 2.1%. For an income investor, that's the difference between $2,100 and $3,500 per year on a $100,000 portfolio — material money, especially in retirement.
The case for SCHD over NOBL: Higher yield, lower fees, better long-term returns, more diversified (100 vs 67 stocks). The only reason to prefer NOBL is the 25-year dividend growth track record — the psychological comfort of knowing every company in the portfolio has a multi-decade commitment to shareholders. For most investors, SCHD is the better practical choice.
Strategy 3: International & China High-Dividend — The Yield Frontier
If you're willing to accept currency risk and lower dividend growth, international and emerging market dividend ETFs offer significantly higher yields:
International Developed Market Dividend ETFs
| ETF | Ticker | Expense Ratio | AUM | Yield | Strategy |
|---|---|---|---|---|---|
| Vanguard International High Dividend Yield | VYMI | 0.22% | ~$8B | ~4.8% | FTSE All-World ex-US High Dividend Yield |
| Schwab International Dividend Equity | SCHY | 0.14% | ~$2B | ~4.5% | Fundamental-weighted ex-US |
| iShares International Select Dividend | IDV | 0.49% | ~$4B | ~6.0% | Dow Jones EPAC Select Dividend |
VYMI holds roughly 1,300 stocks across developed and emerging international markets. Top country weights: Japan (~18%), UK (~12%), China (~10%), Canada (~8%), France (~7%). The 4.8% yield reflects the higher payout ratios of European and Japanese companies, as well as the lower valuations of international markets compared to the US.
SCHY is Schwab's international equivalent of SCHD — fundamental screening for yield + quality. At 0.14%, it's the cheapest pure-play international dividend ETF. The ~4.5% yield, combined with the fundamental quality screen, makes it the default choice for international dividend exposure.
China High-Dividend ETFs: Yield Without Growth
| ETF | Ticker | Expense Ratio | AUM | Yield |
|---|---|---|---|---|
| CSOP CSI Central SOE Dividend 100 ETF (A-share) | 512890 | 0.30% | ~¥25B | ~5.5% |
| ChinaAMC CSI Dividend Index ETF (A-share) | 510880 | 0.30% | ~¥15B | ~5.2% |
| Harvest CSI Central SOE Dividend ETF (A-share) | 159518 | 0.30% | ~¥8B | ~5.8% |
China SOE (State-Owned Enterprise) dividend ETFs are a unique category. The Chinese government has been pushing SOEs to increase dividend payouts as part of the "Chinese Special Valuation" (中特估) initiative — a policy effort to raise the valuations of state-owned enterprises by making them more shareholder-friendly. The result: SOE-heavy ETFs now yield 5-7%, backed by companies (banks, energy, telecom) with implicit government support and very low PE ratios (5-8x).
The catch: capital appreciation has been essentially zero. These are pure income vehicles. The stocks are cheap for a reason — state ownership means limited profit-maximization incentives, and the government can redirect dividends for policy purposes. A 5.5% yield that doesn't grow is less valuable than a 3.5% yield growing at 6% annually (which catches up in roughly 10 years and surpasses thereafter).
| Year | SCHD (3.5% yield, 6% growth) | China SOE ETF (5.5% yield, 0% growth) |
|---|---|---|
| 1 | $3,500 | $5,500 |
| 5 | $4,683 | $5,500 |
| 10 | $6,265 | $5,500 |
| 15 | $8,381 | $5,500 |
| 20 | $11,212 | $5,500 |
Over 20 years, the growing 3.5% yield generates more than double the cumulative income of the static 5.5% yield. Yield today is not yield forever — dividend growth matters enormously over time.
The Tax Math: What Actually Lands in Your Pocket
The headline yield is only half the story. Dividend withholding taxes can take a significant bite. For a detailed comparison of how fees and taxes interact across US, Hong Kong, and China-domiciled ETFs, see our US vs China ETF fee comparison.
| Investor Type | SCHD (US) | 515080 (China A-share) | 2800.HK (HK) |
|---|---|---|---|
| US resident (taxable) | 0% qualified dividend rate (0-20% depending on bracket) | 10% (Stock Connect) | 0% |
| US resident (IRA) | 0% | 10% | 0% |
| China treaty country | 15% (US-China treaty) | 10% | 0% |
| Singapore / non-treaty | 30% | 10% | 0% |
Worked example — US investor putting $50,000 into each:
| SCHD | 515080 (via Stock Connect) | 2800.HK (HK) | |
|---|---|---|---|
| Annual gross dividend | $1,800 | $2,500 | $1,600 |
| Fund fee | −$30 | −$100 | −$35 |
| Withholding tax | $0 (US resident) | −$250 (10%) | $0 |
| Net cash in pocket | $1,770 | $2,150 | $1,565 |
| Net yield | 3.54% | 4.30% | 3.13% |
China delivers roughly 76 basis points more net income — but the risk profile is completely different. State-owned banks and coal miners paying 5%+ yields carry policy risk that SCHD's diversified consumer/healthcare/industrial holdings do not.
The Hong Kong Advantage: 0% Dividend Tax
For non-US investors facing 15-30% US dividend withholding, Hong Kong's 0% dividend tax is a significant structural advantage:
| Investor Country | SCHD Net Yield | 2800.HK Net Yield | Winner |
|---|---|---|---|
| US | 3.5% | 3.1% | SCHD |
| China (treaty) | 3.1% | 3.1% | Tie |
| Singapore (no treaty) | 2.5% | 3.1% | 2800.HK |
| Europe (15% treaty) | 3.1% | 3.1% | Tie |
For Asian investors outside China, HK-domiciled dividend ETFs are often the highest net-yield option — no US withholding, no HK withholding, and local currency settlement. Our Hang Seng Index ETF guide covers the HK ETF ecosystem in more detail.
Performance of International Dividend vs US
| Period | SCHD (US) | SCHY (Intl) | VYMI (Intl) |
|---|---|---|---|
| YTD 2026 | +9% | +10% | +11% |
| 2025 | +12% | +14% | +15% |
| 5-Year Ann. (2021–2025) | +10% | +7% | +6% |
International dividend ETFs have outperformed US dividend ETFs in 2025-2026 as the dollar weakened and international markets recovered. Over five years, US dividend stocks (driven by stronger earnings growth) have outperformed. The trade-off is consistent: higher current yield vs lower growth. For investors building a comprehensive income strategy, our guide to covered call ETFs explores an alternative income approach using options-based strategies.
Building a Dividend Portfolio
Conservative Income Portfolio (Retiree / Risk-Averse)
| ETF | Allocation | Expense Ratio | Blended Yield |
|---|---|---|---|
| SCHD (US High Dividend) | 50% | 0.06% | 1.75% |
| SCHY (International Dividend) | 20% | 0.14% | 0.90% |
| VYMI (EM Dividend) | 10% | 0.22% | 0.48% |
| VGIT (Intermediate Treasuries) | 20% | 0.04% | 0.80% |
| Total | 100% | Blended 0.09% | ~3.93% blended yield |
Growth + Income Portfolio (Accumulator)
| ETF | Allocation | Role |
|---|---|---|
| VOO (S&P 500) | 50% | Core growth |
| SCHD (US Dividend) | 25% | Income + quality tilt |
| SCHY (International Dividend) | 15% | International income diversification |
| Cash / Short-term bonds | 10% | Optionality |
| Total | 100% | Blended yield ~1.8% + growth exposure |
The Bottom Line
Dividend ETFs are having a moment in 2026. Falling rates make bond alternatives less attractive. The semiconductor correction has reminded everyone that growth stocks can fall as fast as they rise. And the structural case for getting paid to wait has rarely been stronger.
For most investors, SCHD (0.06%, 3.5% yield) is the default US dividend choice — cheaper than NOBL, higher yield, better long-term returns, and a quality screen that avoids dividend traps. SCHY (0.14%, 4.5% yield) is the default international choice — the lowest cost, fundamentally-weighted ex-US dividend ETF.
China SOE dividend ETFs (5-7% yield) are tempting for income but come with zero dividend growth, currency risk, and policy uncertainty. They are yield supplements, not core income holdings.
The key principle: yield today matters less than dividend growth over time. A 3.5% yield growing at 6% annually will generate more lifetime income — and higher total returns — than a static 5.5% yield. Don't reach for yield at the expense of growth.
Continue reading: For investors building a multi-asset income portfolio, our covered call ETF guide covers high-distribution strategies that complement traditional dividend ETFs. If you're comparing US and international approaches more broadly, our US vs China ETF fee comparison breaks down how withholding taxes and expense ratios affect net returns.
Sources
- S&P Dow Jones Indices — S&P 500 Dividend Aristocrats Index methodology and constituent data, 2026
- Schwab Asset Management — SCHD and SCHY fund prospectuses, factsheets, and holdings data
- Vanguard — VYM, VYMI, VIGI fund annual reports and distribution histories
- ProShares — NOBL and REGL fund documentation, equal-weight methodology
- CSOP / ChinaAMC / Harvest — China SOE dividend ETF fact sheets and distribution records
- S&P Global Market Intelligence — Dividend growth rates and payout ratio data by sector
- OECD — Cross-border dividend withholding tax treaty rates by country pair
Disclaimer: ETF Bridge is an educational resource. This article does not constitute investment advice. Dividend income is not guaranteed — companies can and do cut or suspend dividends, particularly during economic downturns. International dividend ETFs carry currency risk and may be subject to foreign withholding taxes that reduce net yields for US investors. Past dividend growth rates do not guarantee future increases. Always conduct your own due diligence before investing.